Android internals: ART in practice
Intro
This is the 3rd part of our series about significant changes inside the latest Android version (4.4). If you have checked out part 1 and part 2 from Matthias about the new ART runtime, you might want to play with it a bit.
We’ll cover some of the implications in this article.
Make the switch
Switching to ART looks easy and tempting at a first view, but there are some implications you should know about upfront. The most straight forward way is to use a device which runs the latest Android Version with ART enabled. According to the following devices have ART enabled in the stock ROM:
- Nexus 7 2013
- Nexus 4
- Nexus 5
You might miss the Nexus 7 2012 and Nexus 10.
And unfortunately the ART option is not availble by default on those devices.
However you can try to build a custom AOSP ROM for those devices with ART enabled. Just make sure to include the following lines into your device-config:
PRODUCT_RUNTIMES := runtime_libdvm_default
PRODUCT_RUNTIMES += runtime_libart
This makes sure that you have the classic dalvik as default selected and the ART Runtime as an option included into the build.
In case you have no supported Hardware, you could try the emulator. You’ll be out of luck if you just try the default 4.4 AVD and switch to ART, it will result in an endless boot-loop. This is a know issue, but a fix is already on the way: https://code.google.com/p/android/issues/detail?id=61999
In the meantime you can search the web for already patched emulator images (at your own risk of course).
In case you have passed the obstacles and switched to Art, you will first notice significantly long bootup-time. As Matthias mentioned in his first posts, this step needs to be done in order to convert all Apps and the Framework(!) to OAT files which will run on ART.
Developing on ART
I had the chance to run some tests on 2 Nexus 7 2013 devices in parallel, one running dalvik, the other -of course- on ART. Both devices are on Android 4.4.2.
So in case that you don’t care much about all the details: Is there any difference for you as a developer? In a nutshell: Not really. If you haven’t dealt with details of the dalvik VM in the will barely realize the difference.
Of course you connect your ART enabled device via ADB. Nothing has changed here. When you deploy your shiny application, let’s say via eclipse, it will all work as expected. Of course the logfiles look a bit different, most noticeable some error messages during install and startup phase:
E/art ( 2471): Unrecognized option -XX:mainThreadStackSize=24K
W/art ( 2471): Ignoring unknown -Xgc option: precise
And the already known conversion which takes place instead of the dexopt-step when running on Dalvik:
Dalvik:
I/PackageManager( 580): Running dexopt on: de.inovex.samples I/PackageManager( 580): Package de.inovex.samples codePath changed from /data/app/de.inovex.samples-2.apk to /data/app/de.inovex.samples-1.apk; Retaining data and using new D/dalvikvm(26369): DexOpt: load 58ms, verify+opt 221ms, 1243292 bytes
ART:
I/PackageManager( 609): Running dexopt on: de.inovex.samples
I/PackageManager( 609): Package de.inovex.samples codePath changed from /data/app/de.inovex.samples-2.apk to /data/app/de.inovex.samples-1.apk; Retaining data and using new
I/dex2oat ( 2508): dex2oat: /data/dalvik-cache/data@app@de.inovex.samples-1.apk@classes.dex
Fortunately most of the developing tools also work as expected. I haven’t noticed any significant difference using tools like Traceview or Allocation tracker. Also the debugger works nearly 100% as with dalvik, means that ART has implemented the JDWP Spec. This suspicion can be confirmed by checking the runtime/jdwp/README.txt file in the AOSP-ART directory which states that ART has an incomplete but working JDWP implementation.
One thing you might notice when inspecting objects is that every object has an additional field called shadow$_klass_ Now what is that?
Going through the sources, you’ll find that ART has a different implementation of java.lang.Object compared to dalvik, you can find them here inside the AOSP Source tree:
/libcore/libart/src/main/java/java/lang/Object.java
/libcore/libdvm/src/main/java/java/lang/Object.java
The ART implementation contains this additional field holding the class name of the created object.
I couldn’t figure out why this is needed in detail, feel free to dig deeper into the ART and find good reasons for it.
Heap dumps
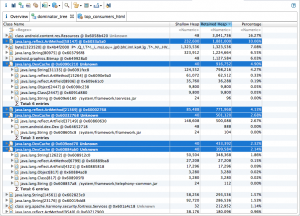
ART does support heap dumps via the hprof file format, which means you can analyze a heap snapshot with tools like jhat or MAT in eclipse. The results are similar to dalvik dumps but there are a some additional objects specific to ART. As you can see in the screenshot it seems like ART needs wrapper or proxy objects for method calling (my guess is into the framework) and these objects are visible in your heap (and do count to your memory consumption as far as I can tell). But if this will stay with future versions of ART or is just the result of the current implementation status: I don’t know.
Garbage collection
One thing that you quickly notice is the new garbage collector. It initially shows up with it’s new log-entries, for example:
I/art ( 5258): GcCauseExplicit concurrent mark sweep GC freed 16(800B) AllocSpace objects, 1(16KB) LOS objects, 0% free, 27MB/28MB, paused 5.035ms total 39.367ms
Compared to the classic Dalvik:
D/dalvikvm(24541): GC_EXPLICIT freed 43K, 66% free 29942K/87404K, paused 9ms+11ms, total 98ms
You’ll get similar information in a slightly different format including the cause, the collector who did the job, heap stats and the pause time.
You’ll notice significant less log-lines regarding the garbage collection. This seems to have 2 root causes:
- Not every GC is logged
- The GC-behaviour is different
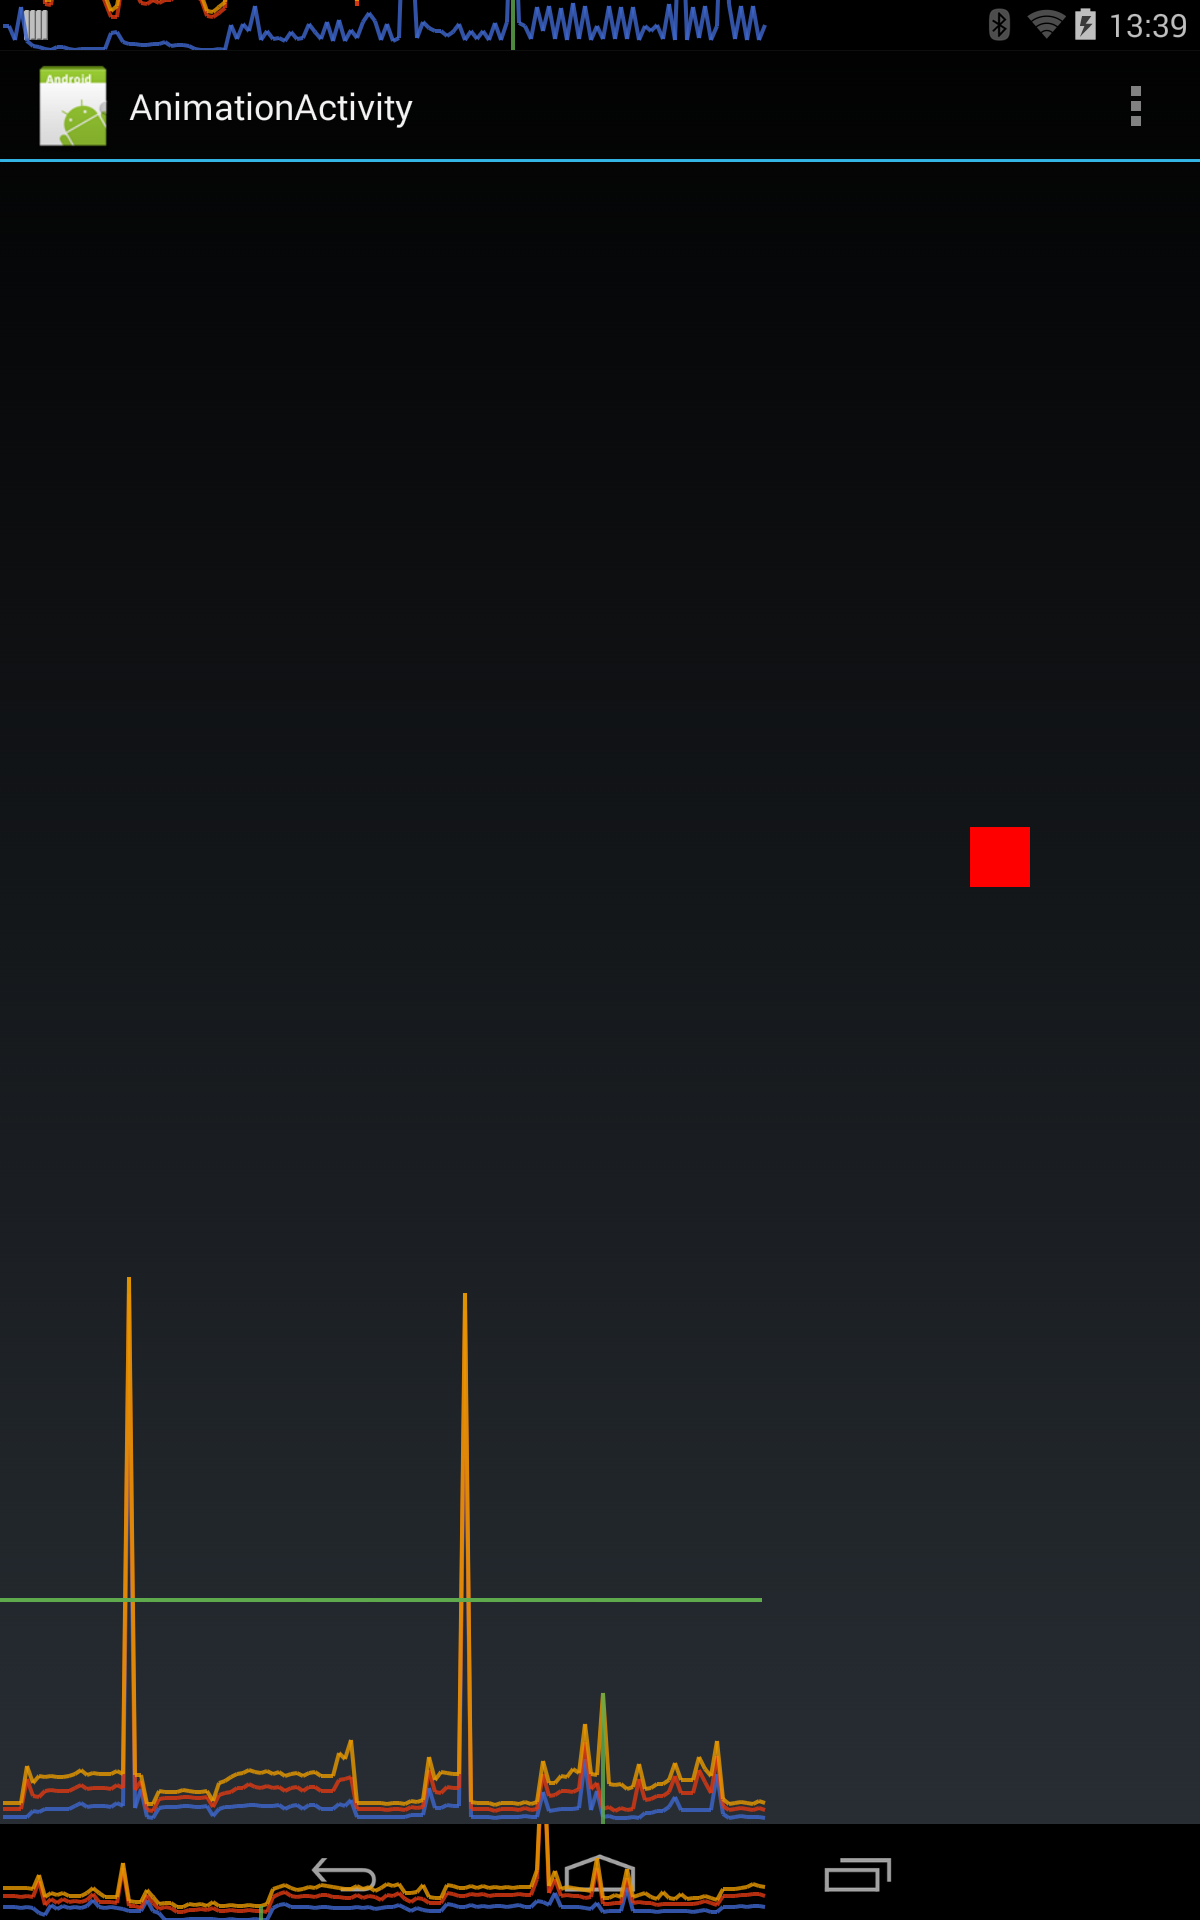
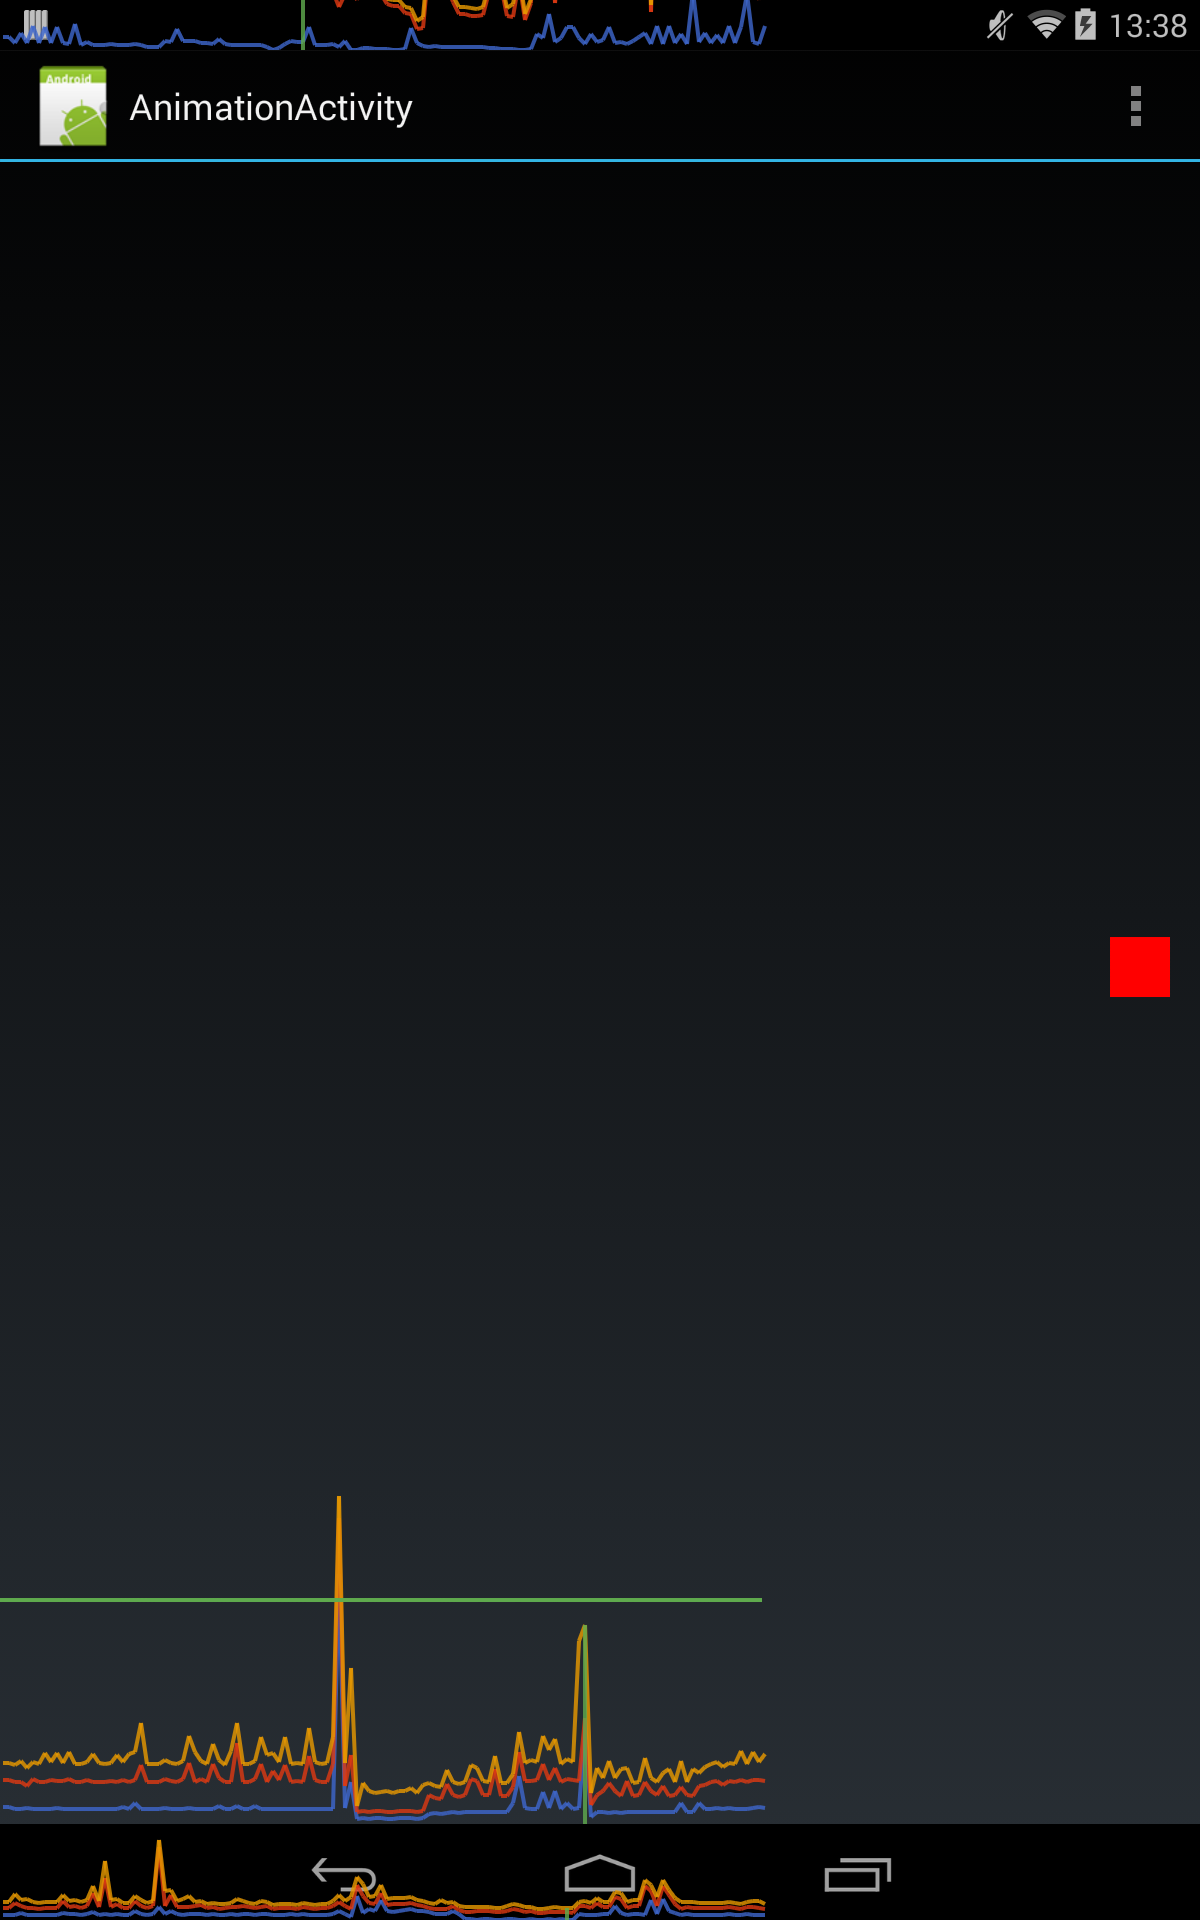
In order to analyze the new GC, I run a test-App which I used to demonstrate GC-pauses. It runs a loop to animate a Rectangle using a custom View and creates objects inside the onDraw – method (which you shouldn’t do, and this shows why). Since the onDraw method is called 60 times per second, the app creates a lot of object and keeps the garbage collector busy. When the GC runs, you’ll usually notice a short frame-drop of the animation.
You can visualize those hickups by using the developer tools and profile the GPU activity as shown in the screenshots below.
Every time a line crosses the green Bar, you have missed a frame.

Dalvik

ART
When running the same App on dalvik compared to ART, you’ll notice that dalvik prints out more GC-messages then ART. It seems that ART is less aggressive running the GC, which leads to fewer hickups. On the downside, the longer you wait, the more objects you have to scan + clean. But the pause times are more or less the same between ART and dalvik.
You can see the results by comparing the 2 screenshots, the dalvik device produced 2 hickups within a short timeframe while the ART runtime only shows one.
For completeness: The other delay you see is caused by the screenshot-process.
Running the GC less often is probably a good thing, as long as pause times don’t get longer. It increases the chance that your animation or transition will not be disrupted by a GC run.
So ART seems to run the GC less frequently. But that is now the whole truth. It also prints out less GC-messages.
When you dig into the sources, there is a place where ART decides if the collection was „slow“. Check
runtime/gc/heap.cc
for details. If it was a slow gc-run, it will collect statistics and log them. The threshold for being slow is defined in
runtime/gc/head.h
and are currently set to 5ms pause time or 100ms gc-run-time. Faster GC runs will not be logged.
From a first view, the GC situation seems to get better as with dalvik. From my very few tests, the GC runs less often with similar or faster pause times compared to dalvik. The decision not to log every GC run (even if there was a short pause) is a bit strange, in my view.
Stability
In general use the ART seem quite stable. But using the development tools like allocation tracker will increase the chance to crash it. I sometimes managed it to get a device reboot while playing with the tools. But that’s okay from my view, as ART is still experimental.
You might also encounter issues with installed apps from the play store. The most popular example is „WhatsApp“ which crashes when using ART. Here is a really good description of this particular edge case by Ian Rogers.
Summary
So what about speed? Everyone is talking about the performance improvements of ART. I skipped the part intentionally. As Matthias pointed out in earlier Posts, ART is running in a very defensive mode. It’s beta. And performance measurements are hard to get right anyhow. I have already said too much about the GC-performance which might not be accurate. I’ll leave this field to others 😉
From a developer’s perspective it’s good to see that google has taken care about our tools. We’ll most likely not loose anything, and there are already more ATRACE-Tags inside the ART compared to dalvik which we get back in systrace.
A probably better GC will help decrease UI-glitches and therefore I’m looking forward to get an even better ART as default runtime.
And not to miss this one: I haven’t touched renderscript and JNI with my tests so far.
